
1. Introduction
A flowchart is a diagram that represents a process, algorithm, or workflow as a sequence of standardized symbols connected by directional arrows. It’s the oldest and most widely used diagram type in process documentation — and it remains the workhorse of business analysis, software design, and operations engineering.
This case study walks through a complete, realistic example — an e-commerce order fulfillment and exception-handling process — and uses it to demonstrate every core concept, usage pattern, and practical technique you’ll need.
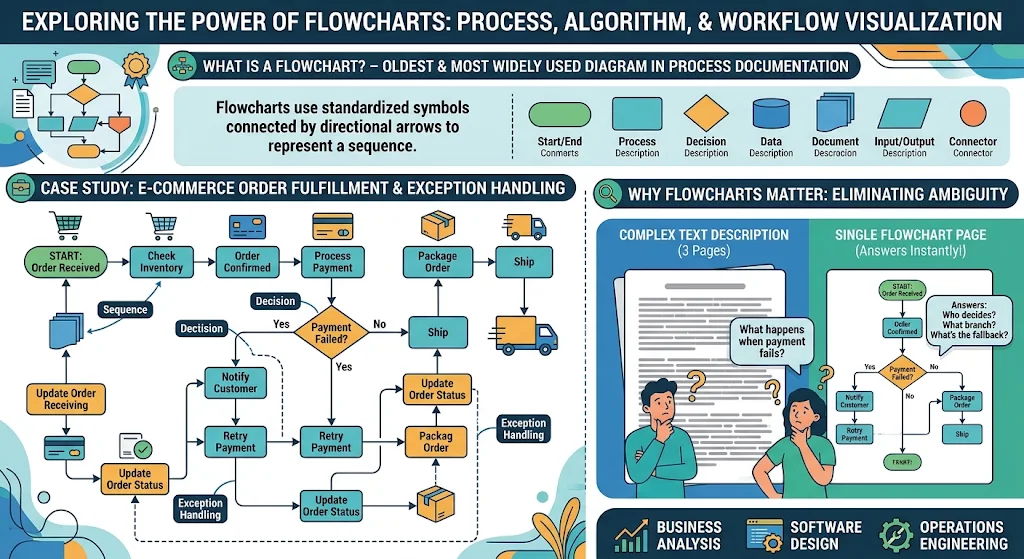
Why flowcharts matter: A single well-made flowchart eliminates ambiguity. Rather than a 3-page text description of “what happens when a payment fails,” one page of symbols answers every question instantly: Who decides? What branch? What’s the fallback?
2. The Case Study: Order Fulfillment at “Mercado” — an Online Retailer
2.1 Context
Mercado is a mid-size online retailer. Its customer support team receives ~4,000 complaints per month. Root cause analysis revealed that 40% stem from confusion about the order fulfillment process — especially exception paths (payment failure, stock-out, address issues).
The operations team’s goal: document the process as a single authoritative flowchart that both the engineering team and the customer support team can read, so that:
-
Support agents can explain any order status accurately
-
Engineers have a spec for refactoring the order service
-
New hires onboard in days rather than weeks
2.2 The Process (narrative)
-
A customer places an order.
-
The system validates the cart and checks inventory.
-
If inventory is insufficient → notify customer of backorder options.
-
If inventory is sufficient → attempt payment authorization.
-
If payment fails → retry up to 3 times, then cancel or hold order.
-
If payment succeeds → reserve stock, create shipment, assign warehouse.
-
Warehouse picks and packs. Quality check performed.
-
If QC fails → return to pick and re-evaluate.
-
If QC passes → hand to carrier, generate tracking number.
-
System emails confirmation to customer. Order closed.
2.3 The Flowchart
Generate Flowchart in Mermaid (Diagram as Code) using VP AI Chatbot:
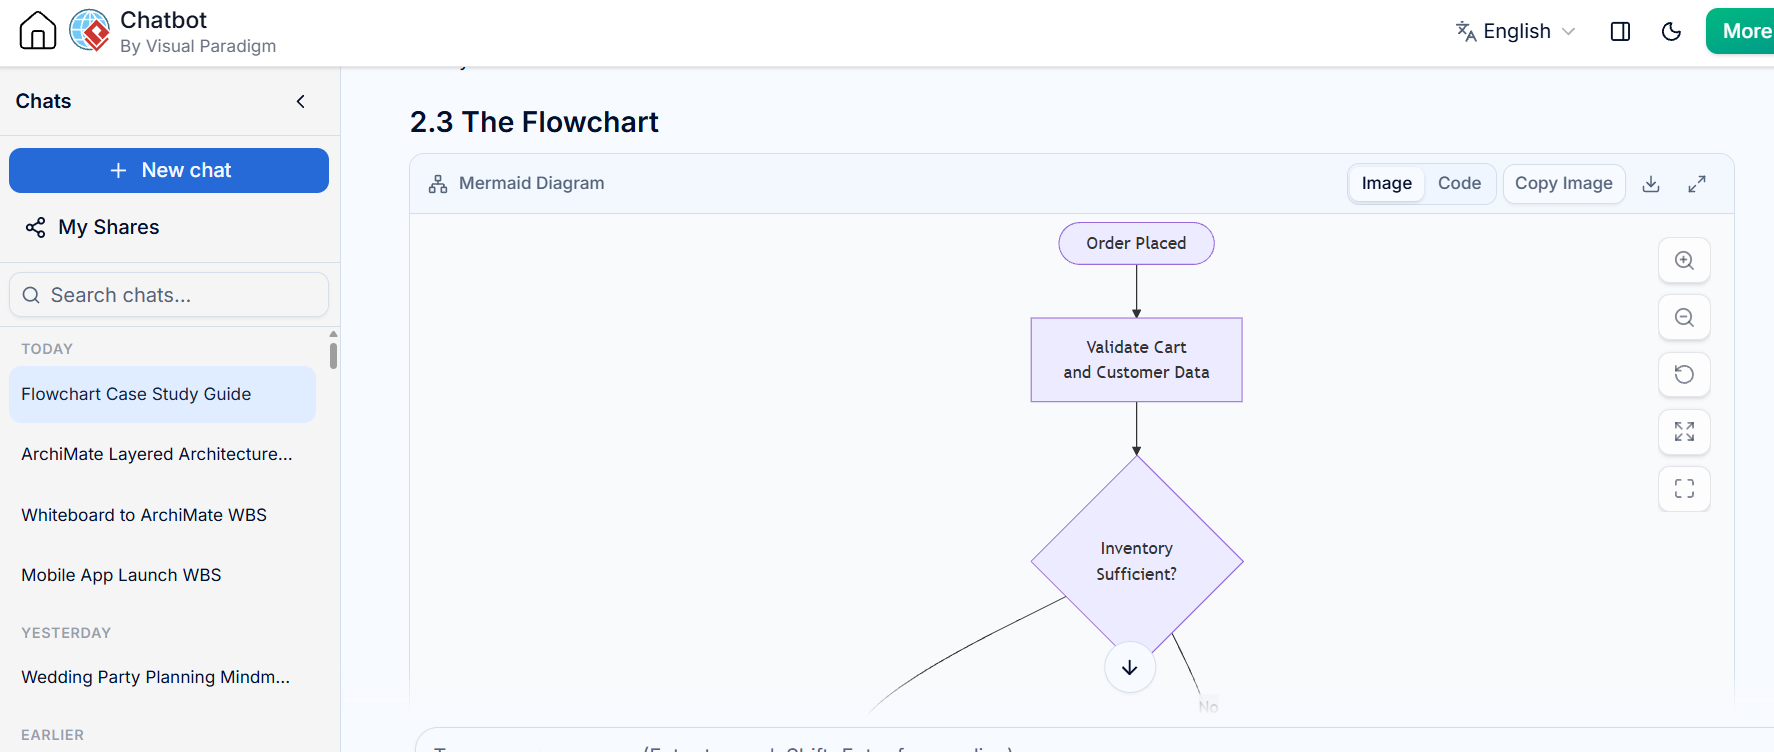
Sent the Diagram with Mermaid Code to VPasCode Tool for Verification:
flowchart TB
    Start([Order Placed]) --> Validate[Validate Cart<br>and Customer Data]
    Validate --> InvCheck{Inventory<br>Sufficient?}

    InvCheck -- No --> Backorder[Offer Backorder<br>or Substitute]
    Backorder --> CustChoice{Accepts<br>Backorder?}
    CustChoice -- No --> CancelOrder[Cancel Order<br>Refund Deposit]
    CancelOrder --> NotifyCancel[Notify Customer<br>Order Cancelled]
    CustChoice -- Yes --> PayAttempt

    InvCheck -- Yes --> PayAttempt[Authorize Payment]

    PayAttempt --> PayResult{Payment<br>Authorized?}
    PayResult -- No --> RetryCount{Retry Attempts<br>< 3?}
    RetryCount -- Yes --> PayAttempt
    RetryCount -- No --> HoldOrder[Place Order on Hold]
    HoldOrder --> NotifyFail[Notify Customer<br>Payment Failed]
    NotifyFail --> EndFail([End: Order Failed])

    PayResult -- Yes --> Reserve[Reserve Inventory<br>and Create Shipment]
    Reserve --> AssignWH[Assign to Warehouse<br>and Generate Pick List]
    AssignWH --> PickPack[Pick and Pack Order]
    PickPack --> QC{Quality Check<br>Passed?}

    QC -- No --> Repack[Repack / Replace Item]
    Repack --> PickPack

    QC -- Yes --> Handover[Hand to Carrier<br>Generate Tracking No.]
    Handover --> EmailConfirm[Email Confirmation<br>with Tracking]
    EmailConfirm --> EndOk([End: Order Shipped])
Reading it: Ovals = start/end terminals. Rectangles = actions. Diamonds = decisions. Every diamond has exactly two labeled outgoing paths.
3. Key Concepts
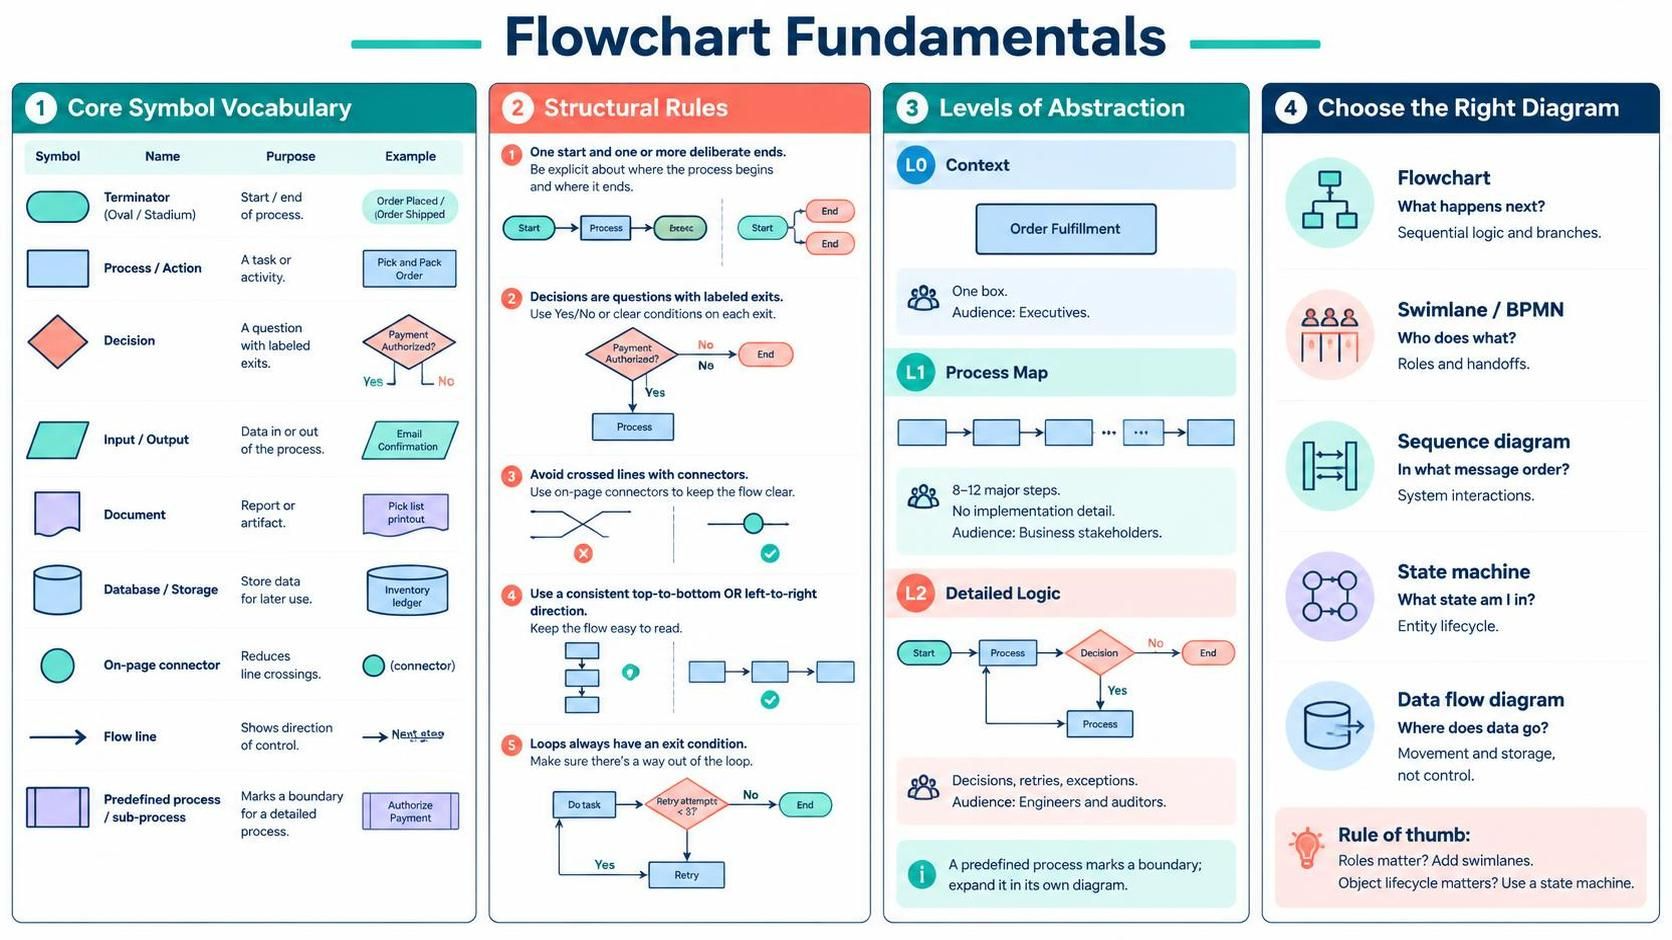
3.1 The Core Symbol Vocabulary
| Symbol | Name | Purpose | In our example |
|---|---|---|---|
| Oval / Stadium | Terminator | Start or end of process | Order Placed, End: Order Shipped |
| Rectangle | Process / Action | A step that does work | Pick and Pack Order |
| Diamond | Decision | A branch point with a question | Payment Authorized? |
| Parallelogram | Input / Output | Data entering or leaving | Email Confirmation |
| Document | Data on paper/report | Physical or file artifact | Pick list printout |
| Cylinder | Database / Storage | Persisted state | Inventory ledger |
| Circle / Connector | On-page connector | Jump point to reduce line crossings | Used on multi-page charts |
| Arrow | Flow line | Direction of control | All connections |
| Predrawn Process | Predefined process | A sub-process defined elsewhere | Authorize Payment (in a payment-service chart) |
3.2 Structural Rules That Make or Break a Flowchart
-
One start, one (or more) ends. Every path must terminate deliberately — no arrows “fading out.”
-
Decisions are questions with explicit exits. Label the arrows (
Yes/No, or condition names), not just the diamond. A diamond with three unnamed arrows is unreadable. -
No crossed lines where avoidable. Connectors and careful layout beat spaghetti.
-
Flow direction consistency. Top-to-bottom or left-to-right — pick one and stay with it.
-
Loops must have an exit condition. The
Retry Attempts < 3?gate above prevents an infinite retry loop — this is the single most common flowchart design flaw.
3.3 Levels of Abstraction
The same process exists on at least three levels, and mixing them is a classic mistake:
| Level | Shows | Audience |
|---|---|---|
| L0 — Context | One box: “Order Fulfillment” | Executives |
| L1 — Process map | 8–12 major steps, no implementation detail | Business stakeholders |
| L2 — Detailed logic | Every decision, retry, and exception | Engineers & auditors |
Our case study is a L2 chart. The Authorize Payment node, in an L1 chart, would expand into its own diagram — the “predefined process” symbol exists precisely to mark that boundary.
3.4 Flowchart vs. Related Diagrams
| Diagram | Question it answers | Use when |
|---|---|---|
| Flowchart | What happens next? | Sequential logic with branches |
| Swimlane / BPMN | Who does what? | Multi-role handoffs, SLA tracking |
| Sequence diagram | In what message order? | System-to-system interactions |
| State machine | What state am I in? | Entity lifecycle (order status) |
| Data flow diagram | Where does data go? | Data movement & storage, not control |
Rule of thumb: if roles matter, add swimlanes to your flowchart; if object lifecycle matters, switch to a state machine.
4. Usage Cases
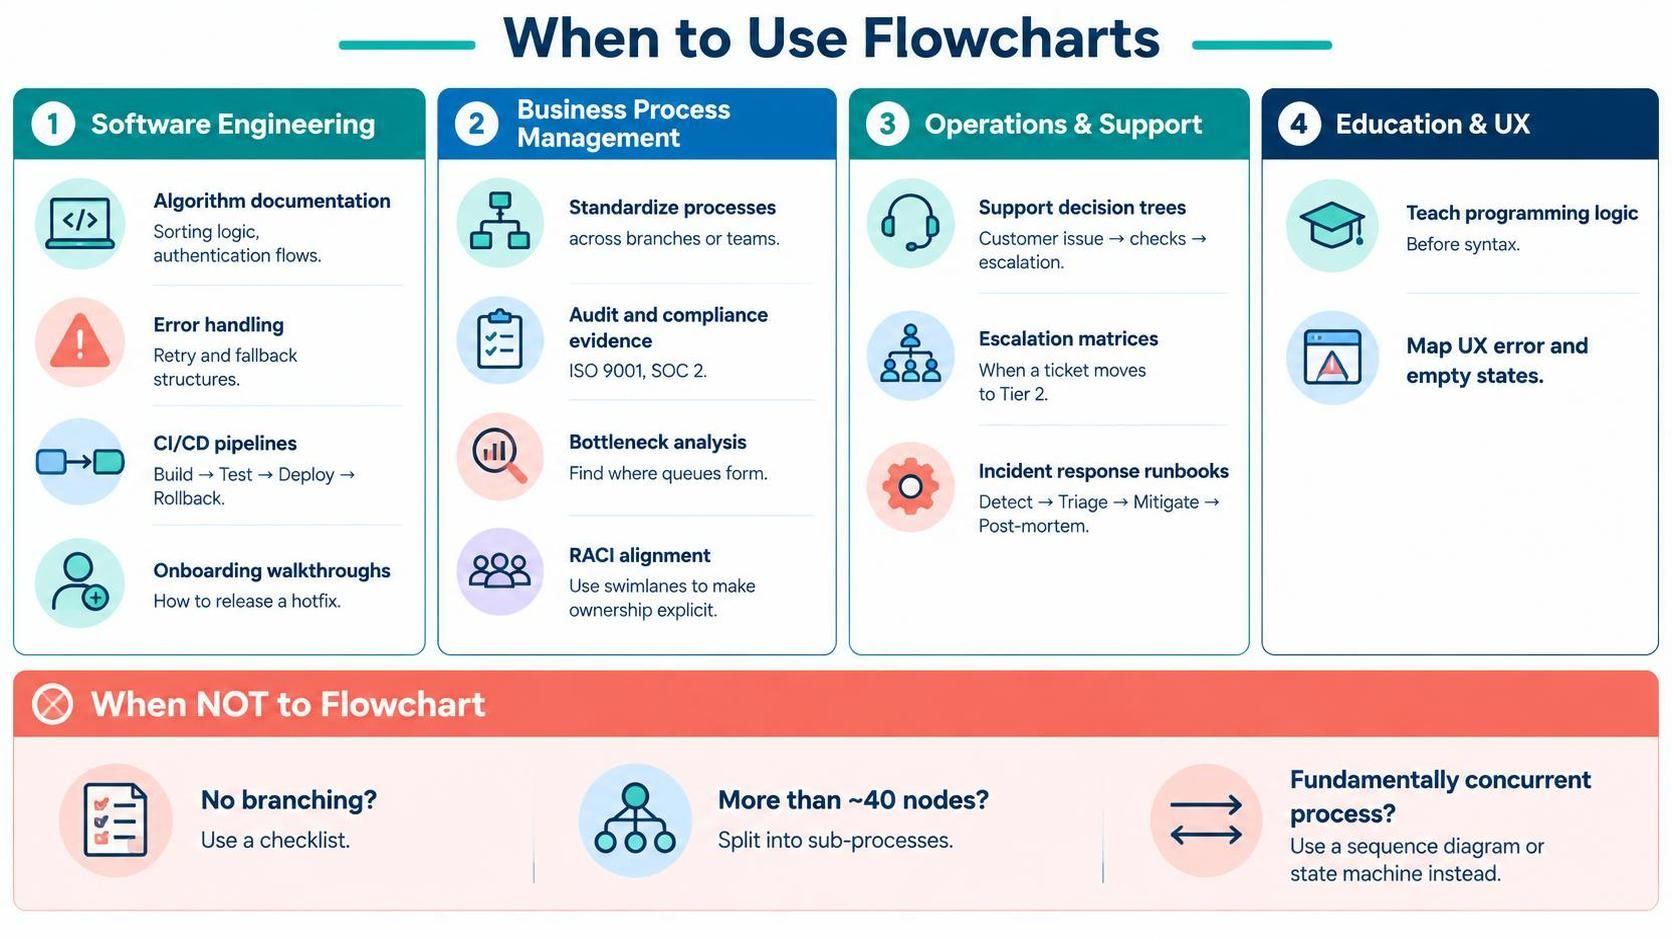
4.1 Software Engineering
-
Algorithm documentation — sorting logic, authentication flows
-
Error handling specs — the retry/fallback structure shown above
-
CI/CD pipelines — build → test → deploy → rollback
-
Onboarding walkthroughs — “how to release a hotfix”
4.2 Business Process Management
-
Process standardization across branches or teams
-
Audit and compliance evidence — ISO 9001, SOC 2 auditors ask for exactly this
-
Bottleneck analysis — where do queues form?
-
RACI alignment — extend to swimlanes to make ownership explicit
4.3 Operations & Support
-
Support decision trees — “If customer says X, check Y, then escalate”
-
Escalation matrices — when does a ticket move to Tier 2?
-
Incident response runbooks — detect → triage → mitigate → post-mortem
4.4 Education & UX
-
Teaching programming logic before syntax
-
UX journey mapping of error and empty states
4.5 Deciding when not to flowchart
Skip the flowchart if: the process has no branch logic (a checklist is better), there are more than ~40 nodes (split into sub-processes), or the domain is fundamentally concurrent (use a sequence diagram or state machine instead).
5. Tips and Tricks
5.1 Design Craft
-
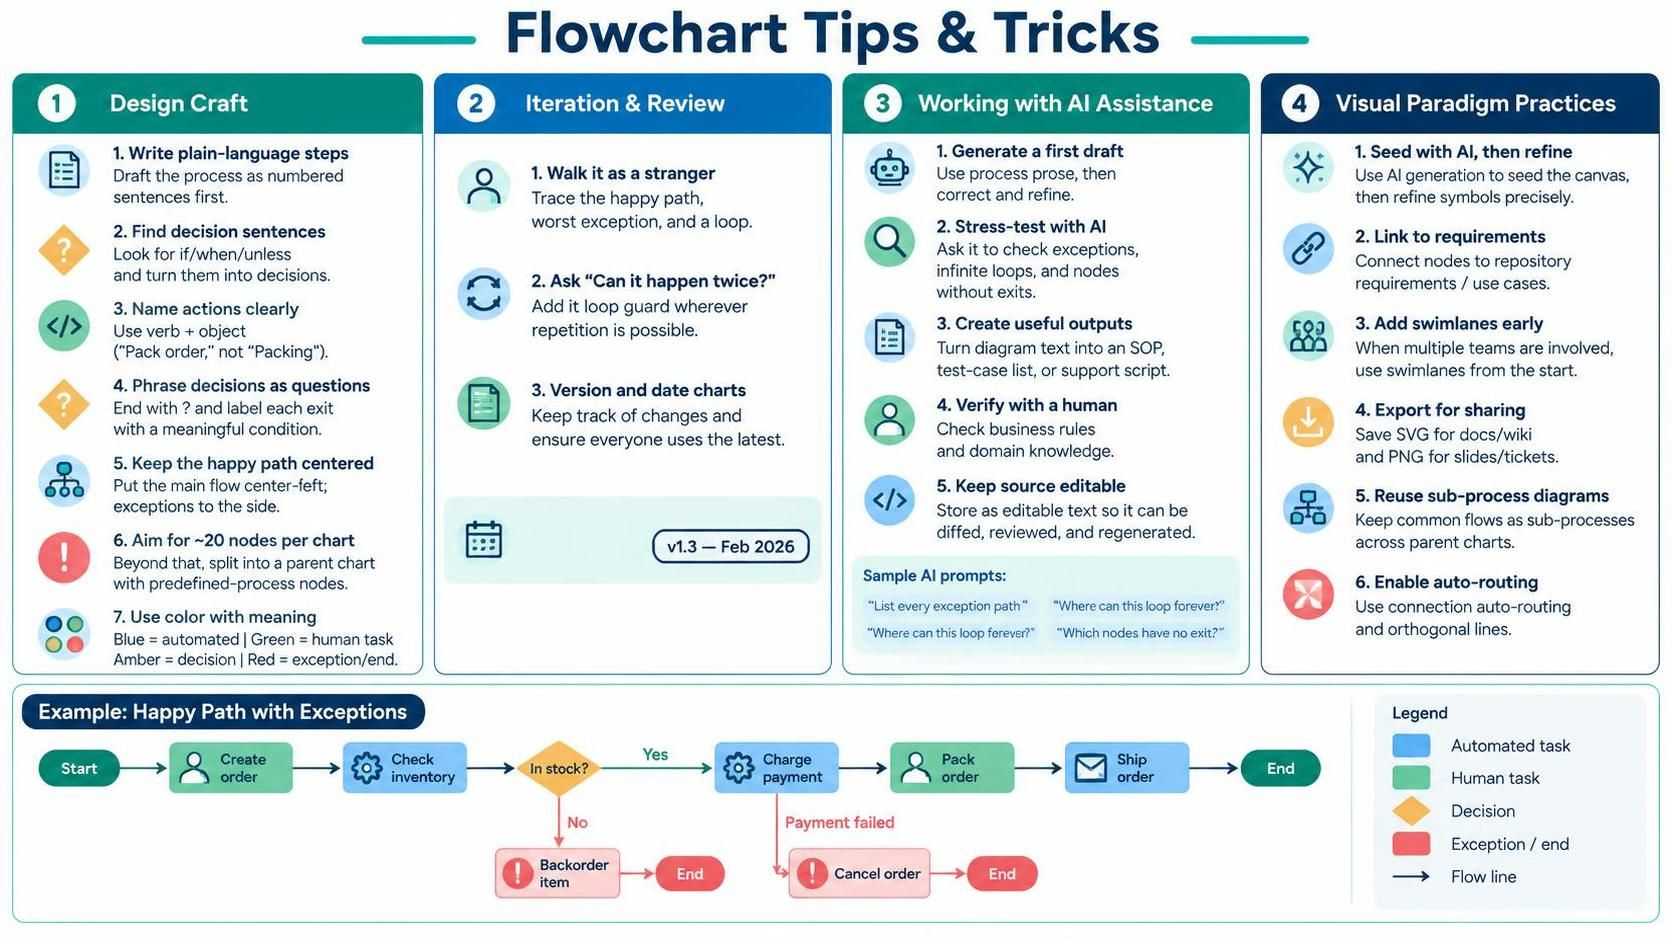
Draft in plain language first. Write the process as numbered sentences. Then identify which sentences are decisions (they contain “if,” “when,” “unless”). Converting prose to symbols is far easier than inventing structure directly on canvas.
-
Name processes with verb + object. “Pack order” ✔ — “Packing” ✘.
-
Phrase decisions as yes/no questions ending in “?” so arrow labels fall naturally.
-
Put the happy path down the center-left and push exception branches to the side. This makes the “normal” story scannable.
-
Cap node count per chart at ~20. Beyond that, split into a parent chart with predefined-process nodes.
-
Use color for meaning, not decoration. One convention that works: blue = automated, green = human task, amber = decision, red = exception/end.
-
Always label the decision exits — and prefer meaningful labels (
Insufficient stock) over bareNo.
5.2 Iteration & Review
-
Walk the chart as a stranger. Trace three paths: the happy path, the worst exception, and a loop. Every gap hides in the exception paths.
-
Test with a “can it happen twice?” pass. Any action that could repeat needs a loop guard, just like
Retry Attempts < 3?. -
Version and date your charts. A flowchart without a version stamp becomes untrustworthy fast. Put
v1.3 — Feb 2026in a corner.
5.3 Working with AI Assistance
This is where modern tooling changes the economics of diagramming:
-
Generate the first draft from prose. Paste your process description into the AI assistant and ask for the diagram — then correct it rather than construct it. Getting to 80% in seconds beats 20% in an hour.
-
Ask the AI to stress-test your logic. Prompts that work well: “List every exception path a user could hit in this process”, “Where can this flowchart loop forever?”, “Which nodes have no defined exit?”
-
Use AI for the reverse direction. Paste existing diagram text and ask for a written SOP, a test-case list, or a support script — one diagram, three artifacts.
-
Verify, always. AI drafts are confident, not correct. Treat AI output as a peer review candidate: it needs a human pass on business rules. This is exactly why the validation step matters.
-
Keep the source as text. Text-based diagram source (rather than a flat image) is diffable, reviewable in pull requests, and regenerable — a huge advantage for living documentation.
5.4 Visual Paradigm–Specific Practices
-
Use the AI-assisted generation to seed the canvas, then refine with the full symbol palette so you control semantics precisely.
-
Link nodes to requirements/use cases in the repository — the flowchart becomes navigable documentation rather than a picture.
-
Use swimlanes early if more than one team touches the process; retrofitting lanes later forces a full re-layout.
-
Export to both SVG and PNG: SVG for documents/wiki, PNG for slide decks and tickets.
-
Reuse sub-process diagrams across parent charts so a change propagates once.
-
Turn on connection auto-routing and orthogonal line style for a clean, professional look.
6. Guidelines (Checklist)
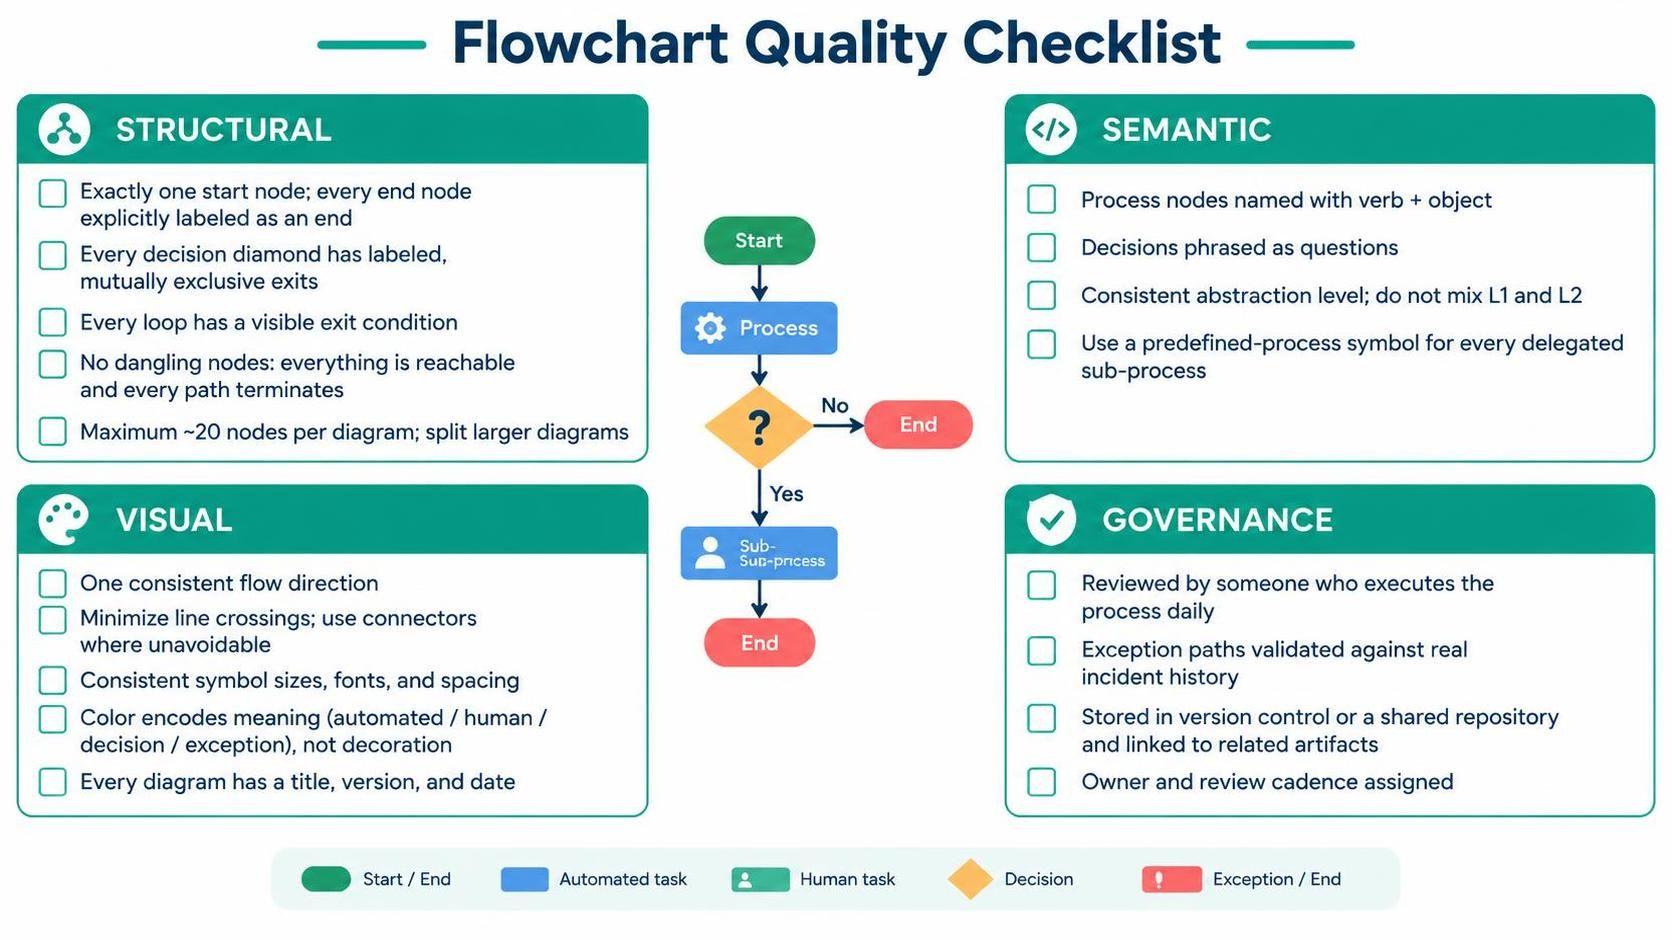
Structural
-
Exactly one start node; every end node explicitly labeled as an end
-
Every decision diamond has labeled, mutually exclusive exits
-
Every loop has a visible exit condition
-
No dangling nodes — everything reachable, everything terminates
-
Maximum ~20 nodes per diagram; split beyond that
Semantic
-
Process nodes named verb + object
-
Decisions phrased as questions
-
Consistent abstraction level — no mixing of L1 and L2
-
Predefined-process symbol used for any delegated sub-process
Visual
-
Single consistent flow direction
-
Minimal line crossings; connectors used where unavoidable
-
Consistent symbol sizes, fonts, and spacing
-
Color encodes meaning (automated/human/decision/exception), not decoration
-
Title, version, and date on every diagram
Governance
-
Chart reviewed by someone who executes the process daily
-
Exceptions paths validated against real incident history
-
Chart stored in version control or the shared repository, linked to related artifacts
-
Owner and review cadence assigned
7. Lessons from the Mercado Case
-
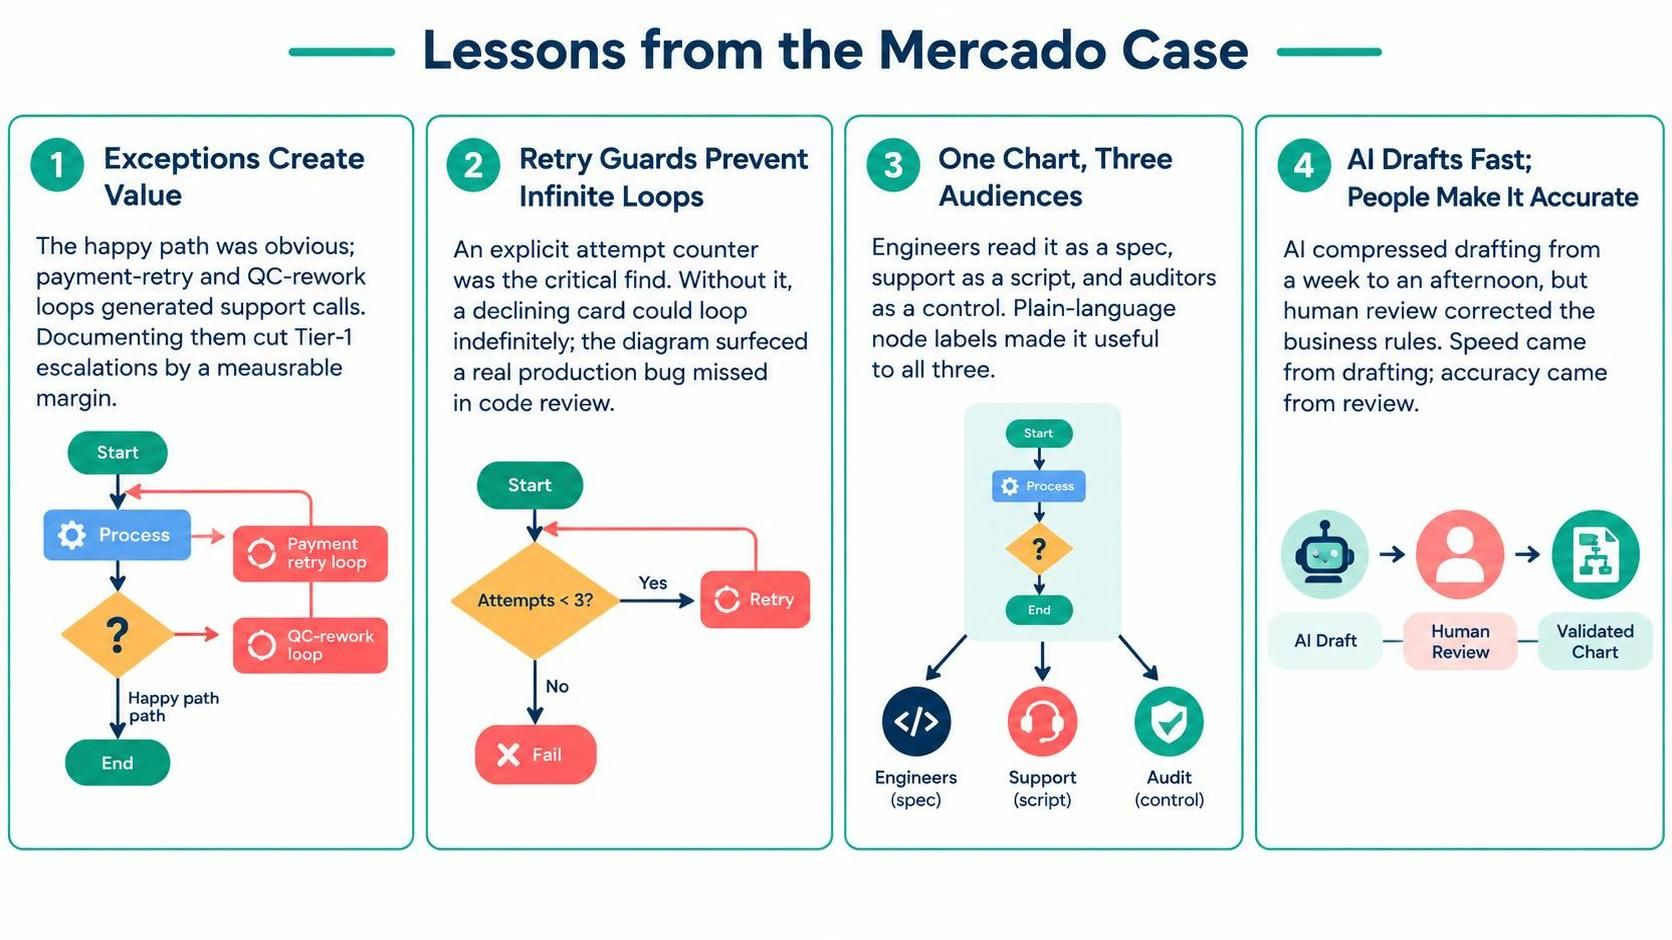
The exception paths held all the value. The happy path was obvious; the payment-retry and QC-rework loops were where support calls originated. Documenting them cut Tier-1 escalations by a measurable margin.
-
The retry guard was the critical find. Without an explicit attempt counter, the original process could loop indefinitely on a declining card — a real production bug surfaced by the diagram, not by code review.
-
One chart, three audiences. Engineers read it as a spec, support read it as a script, auditors read it as a control. Writing node labels for a non-technical reader made it usable by all three.
-
AI drafting compressed the timeline from a week to an afternoon — but the human review was still where the business rules got corrected. Speed came from drafting; accuracy came from review.
-
Lessons from the Mercado Case
-
The exception paths held all the value. The happy path was obvious; the payment-retry and QC-rework loops were where support calls originated. Documenting them cut Tier-1 escalations by a measurable margin.
-
The retry guard was the critical find. Without an explicit attempt counter, the original process could loop indefinitely on a declining card — a real production bug surfaced by the diagram, not by code review.
-
One chart, three audiences. Engineers read it as a spec, support read it as a script, auditors read it as a control. Writing node labels for a non-technical reader made it usable by all three.
-
AI drafting compressed the timeline from a week to an afternoon — but the human review was still where the business rules got corrected. Speed came from drafting; accuracy came from review.
-
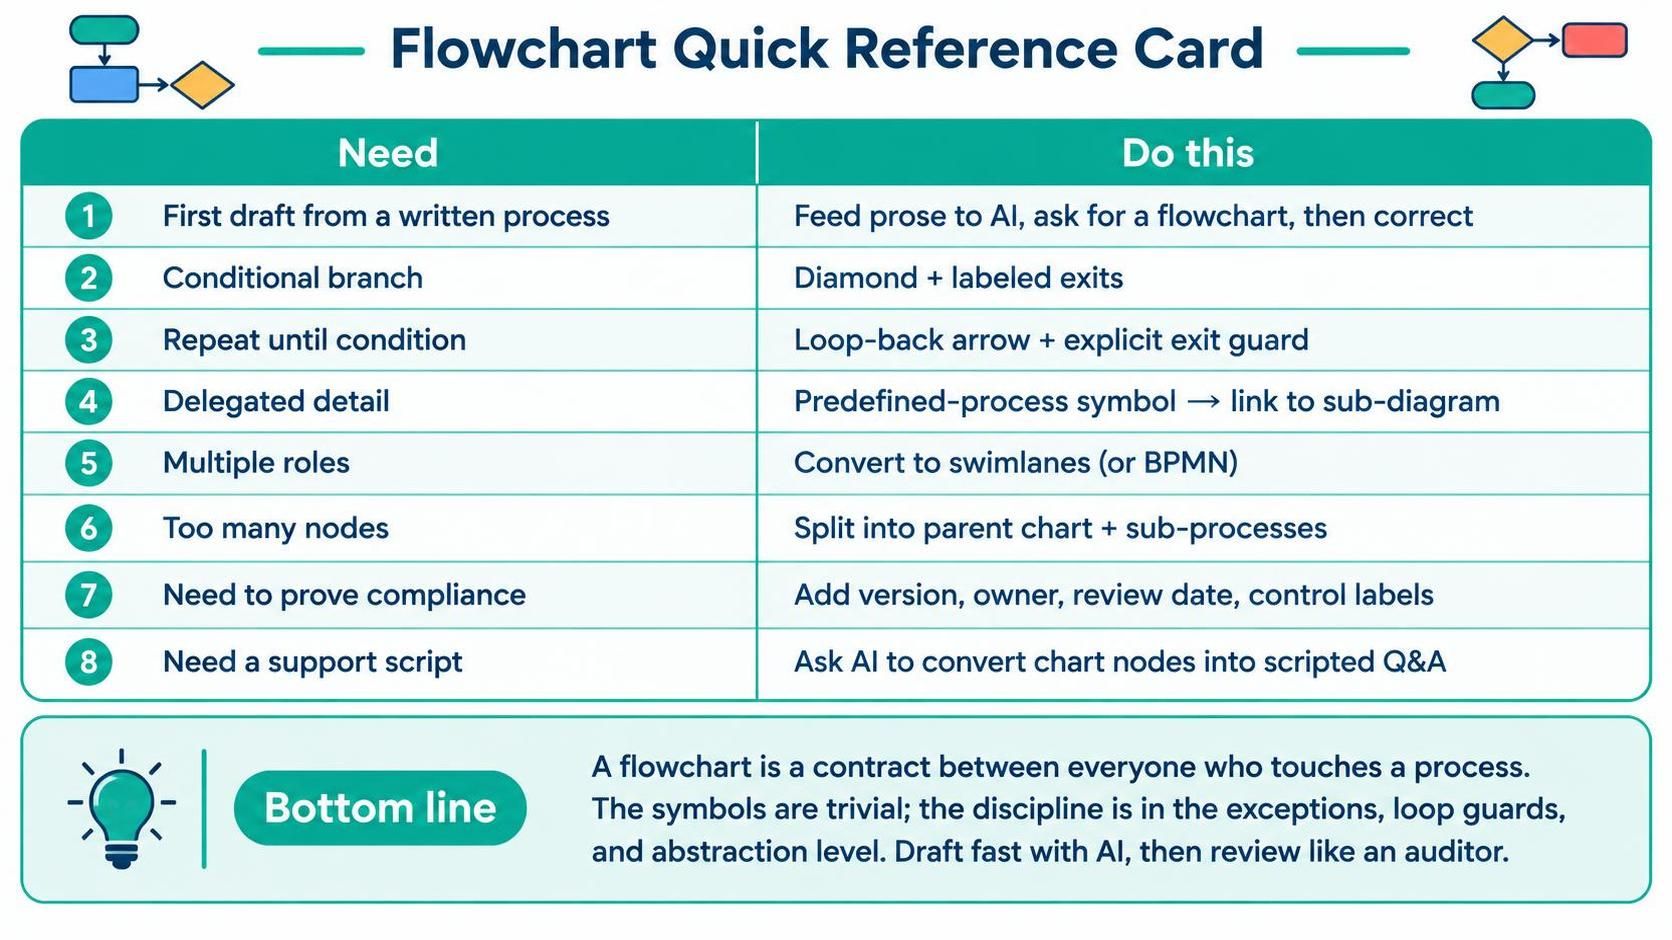
8. Quick Reference Card
| Need | Do this |
|---|---|
| First draft from a written process | Feed prose to AI, ask for a flowchart, then correct |
| Conditional branch | Diamond + labeled exits |
| Repeat until condition | Loop back arrow + explicit exit guard |
| Delegated detail | Predefined-process symbol → link to sub-diagram |
| Multiple roles | Convert to swimlanes (or BPMN) |
| Too many nodes | Split into parent chart + sub-processes |
| Need to prove compliance | Add version, owner, review date, control labels |
| Need a support script | Ask AI to convert the chart nodes into scripted Q&A |
Bottom line: A flowchart is a contract between everyone who touches a process. The symbols are trivial; the discipline is in the exceptions, the loop guards, and the abstraction level. Draft fast with AI, then review like an auditor — that combination is what separates documentation that gets used from documentation that gets archived.