
Introduction
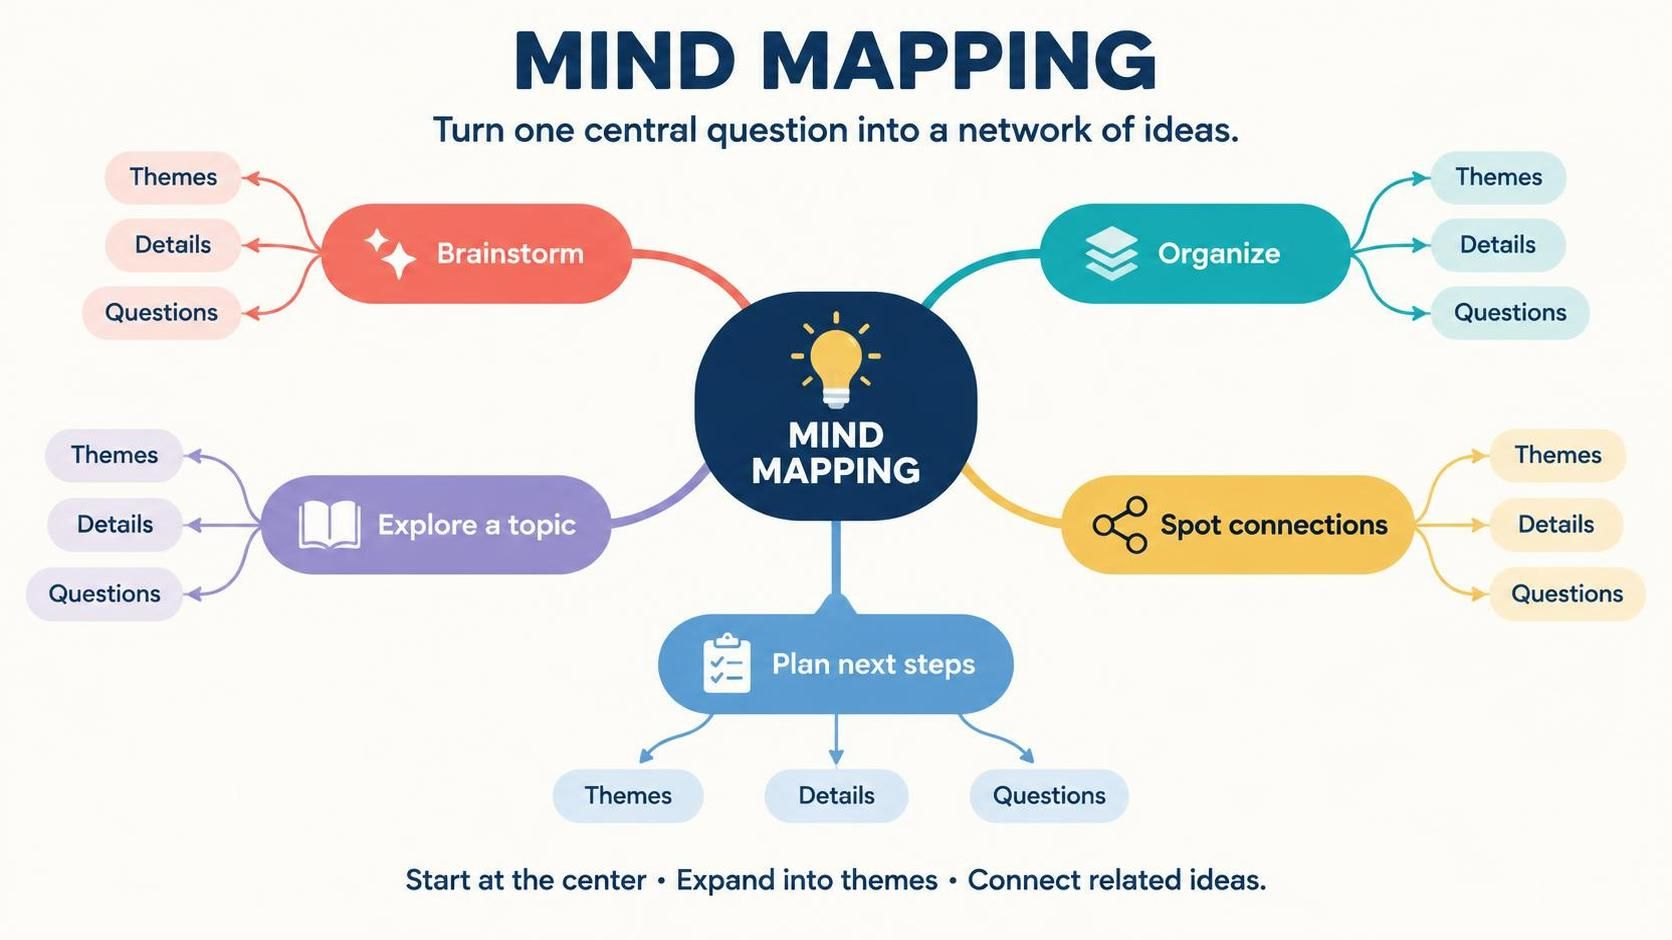
Mind mapping turns a topic into a visual network of ideas. By starting with a central question and expanding into related themes and details, you can brainstorm, organize information, spot connections, and plan next steps. This guide covers the core principles of mind mapping, practical ways to use it, and how to create a map with Visual Paradigm Desktop or Visual Paradigm Online.
A mind map is a visual way to capture and organize ideas around a central topic. The main idea sits at the center; related ideas extend outward as branches, with narrower details on sub-branches. This layout helps you see both the overall subject and how its parts relate.
Core concepts
-
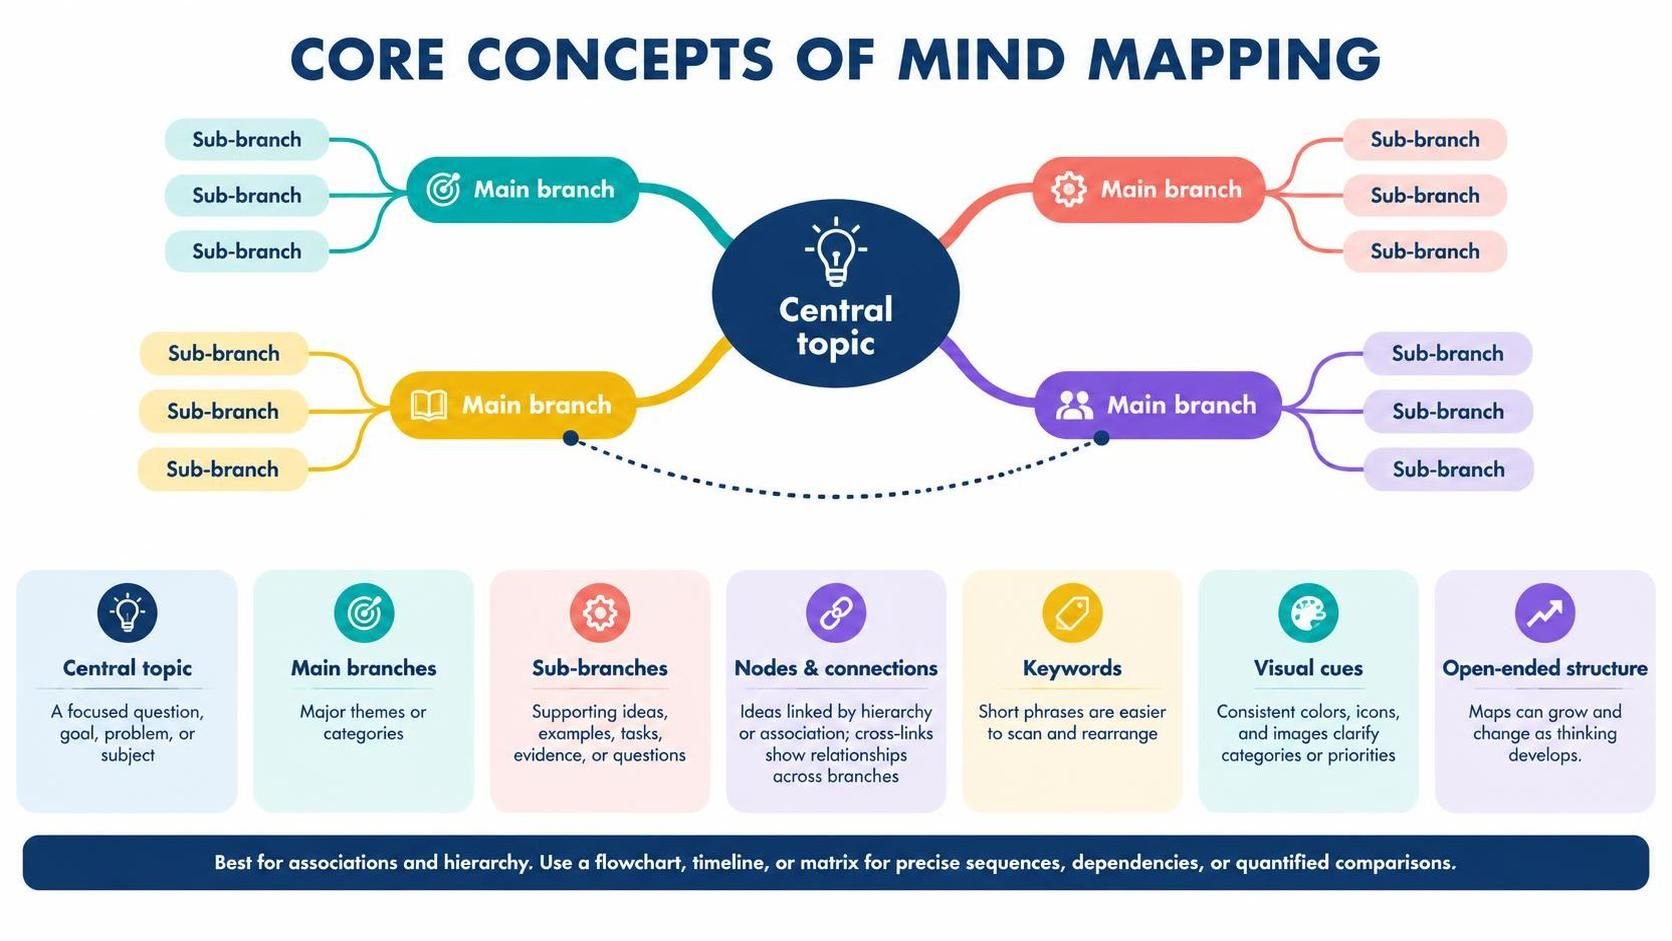
Central topic: The question, goal, problem, or subject the map explores. Make it specific enough to guide the map—for example, “Plan a customer onboarding process” rather than simply “Customers.”
-
Main branches: The major themes or categories related to the central topic. Start with a manageable number and expand as needed.
-
Sub-branches: Supporting ideas, examples, tasks, evidence, or questions under each branch.
-
Nodes and connections: Nodes hold ideas; branches show hierarchy or association. A node’s position conveys its place in the structure, while a cross-link can show a relationship between ideas on separate branches.
-
Keywords: Short phrases are usually easier to scan and rearrange than long paragraphs. Add fuller notes when nuance matters.
-
Visual cues: Color, icons, and images can help distinguish categories or flag priorities. Use them consistently; decoration should support understanding, not distract from it.
-
Open-ended structure: A map can grow and change as thinking develops. It is a working representation, not necessarily a final plan or a complete explanation.
A basic mind map primarily shows associations and hierarchy. It is less suited to representing exact sequences, dependencies, or quantified comparisons; a flowchart, timeline, or matrix may be better for those.
A practical process
-
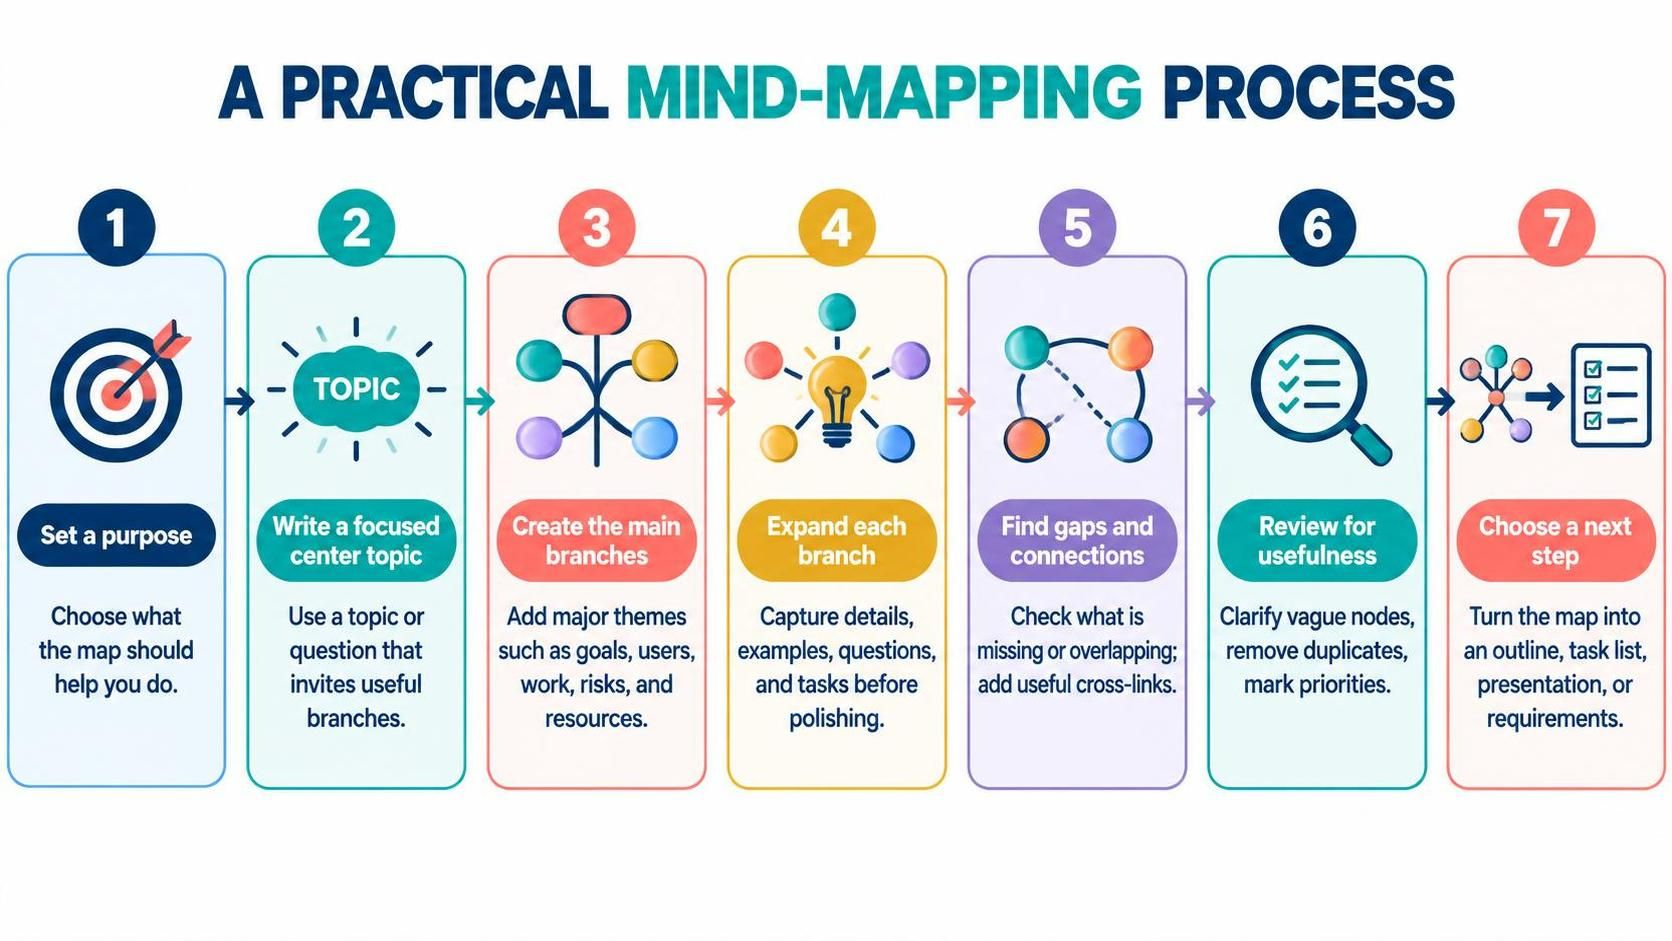
Set a purpose. Decide what the map should help you do: generate ideas, understand a subject, plan a project, or make a decision.
-
Write a focused center topic. Phrase it as a topic or question that invites useful branches.
-
Create the main branches. Add the major themes that come to mind. For a project plan, these might be “goals,” “users,” “work,” “risks,” and “resources.”
-
Expand each branch. Add details, examples, open questions, and related tasks. Capture ideas first; organize and polish afterward.
-
Look for missing pieces and connections. Ask what is absent, what overlaps, and which ideas connect across branches. Use cross-links where they clarify a real relationship.
-
Review for usefulness. Rename vague nodes, remove duplication, and mark priorities or unresolved questions.
-
Choose a next step. Turn the map into an outline, task list, presentation, requirements set, or another format if the work needs more precision.
Common use cases
-
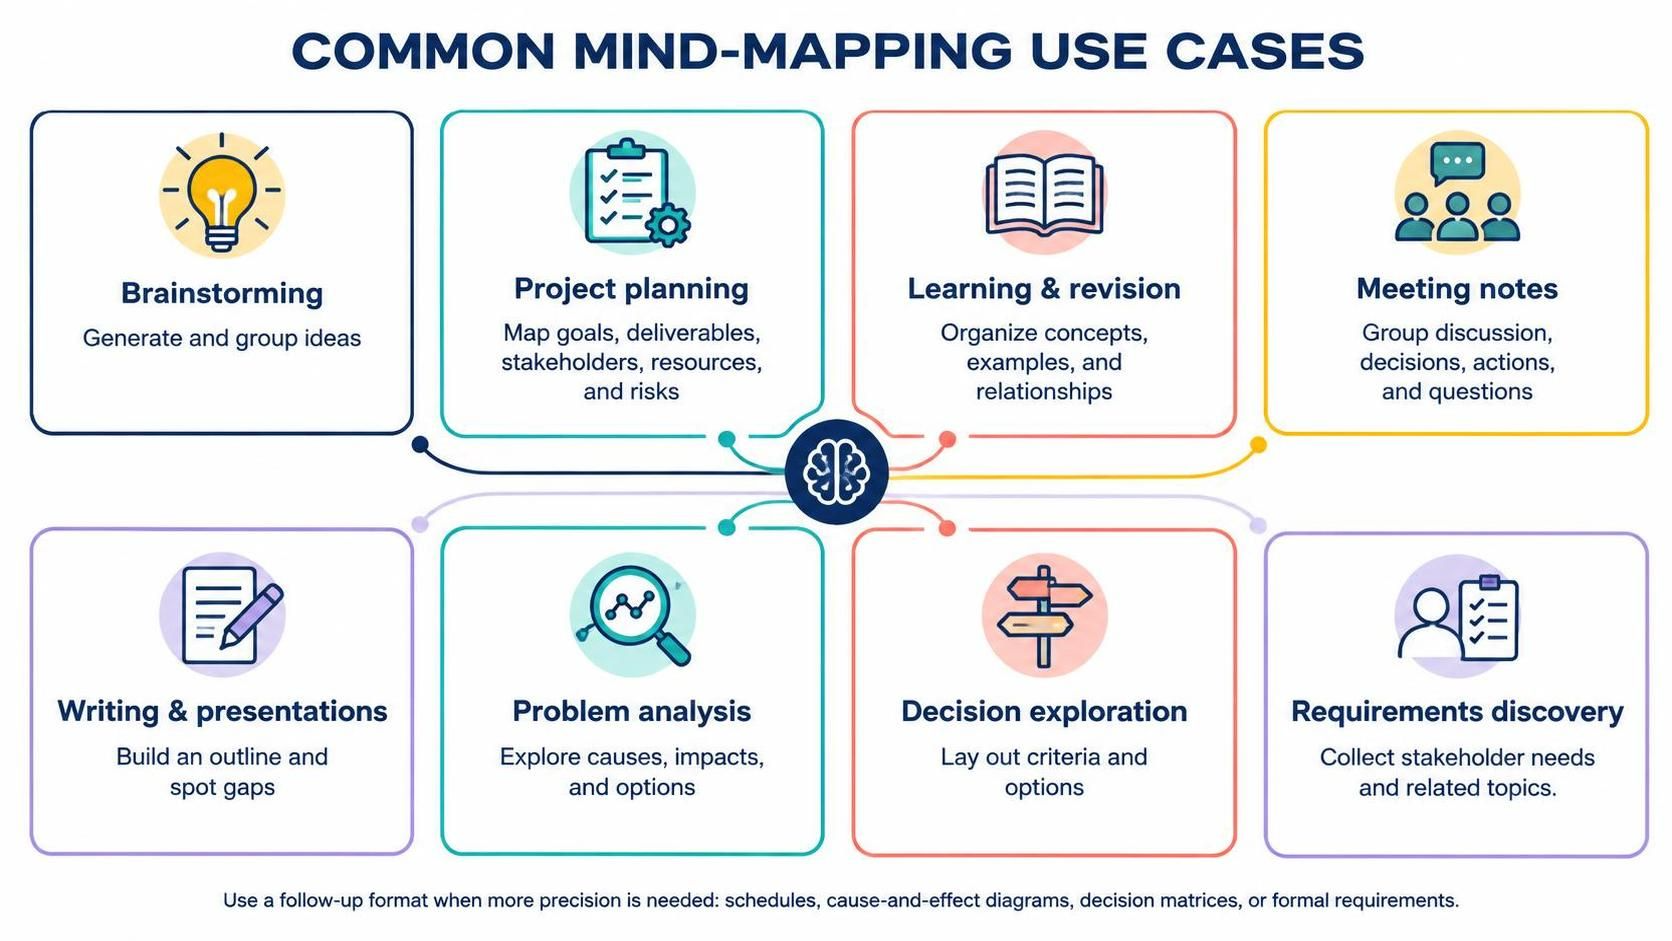
Brainstorming: Generate and group ideas around a product, campaign, event, or challenge.
-
Project planning: Map goals, deliverables, stakeholders, resources, risks, and questions before producing a schedule or work breakdown.
-
Learning and revision: Organize a topic into concepts, examples, and relationships; use the map as a study aid.
-
Meeting notes: Capture discussion by theme, then separate decisions, actions, and unresolved issues.
-
Writing and presentations: Build an outline, arrange supporting points, and identify gaps before drafting.
-
Problem analysis: Explore possible causes, impacts, and options. For a formal cause-and-effect analysis, a fishbone diagram may be more appropriate.
-
Decision exploration: Lay out criteria and options, then follow up with a decision matrix or other structured comparison.
-
Requirements discovery: Collect stakeholder needs and related topics before translating them into formal requirements or models.
Making maps clear and useful
-
Keep each node focused on one idea.
-
Use branch labels that make the grouping understandable.
-
Apply colors or icons consistently—for example, one color for risks and another for actions.
-
Use cross-links sparingly so the map remains easy to read.
-
Distinguish ideas from decisions and assigned actions; a mind map alone does not track ownership or completion.
-
For collaborative work, agree on a simple convention for priorities, questions, and decisions.
-
Treat AI-generated branches, if used, as suggestions to review—not as validated research or final decisions.
Using Visual Paradigm
Visual Paradigm provides mind mapping tools in its Desktop and Online offerings. Its feature page describes branches, connectors between related ideas, node icons, automatic branch coloring, and keyboard shortcuts for creating nodes. The product also describes AI-assisted generation of a mind map from a topic or problem statement.
Visual Paradigm Desktop
The documented desktop workflow is:
-
Choose Diagram > New.
-
Select Mind Map Diagram, then choose Next.
-
Pick a template or Blank, then choose Next.
-
Name the diagram and select OK.
-
Enter the central idea.
-
Add and organize branches using drag-and-drop.
-
Export the finished diagram as an image, such as JPG, PNG, PDF, or SVG.
Desktop is a natural choice when you want to work in the installed application or alongside other Visual Paradigm modeling tools. Check the edition comparison for the mind-mapping capability included in the plan you use.
Visual Paradigm Online
VP Online is browser-based and includes online diagramming tools; its site also describes AI tools for generating mind maps. It can be a convenient choice when you want to work in a browser rather than install desktop software.
A good starter map
For a project kickoff, put “Launch a new service” at the center and branch into:
-
Goals: desired outcomes, success measures
-
Users: audiences, needs, accessibility
-
Scope: included features, exclusions
-
Work: research, design, build, testing, launch
-
People: owners, reviewers, stakeholders
-
Risks: dependencies, unknowns, mitigations
-
Next steps: immediate actions, decisions needed
Keep this map exploratory. Once the team agrees on scope and responsibilities, move the relevant information into a formal plan or task tracker.
Conclusion